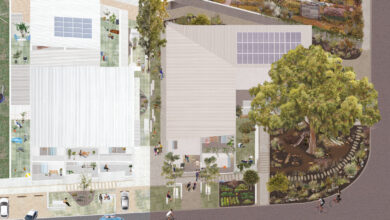
Richard Weller’s Atlas for the End of the World as We Know It
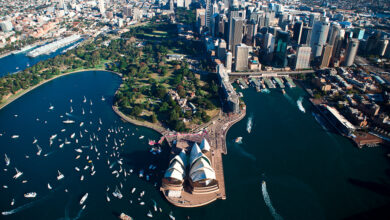
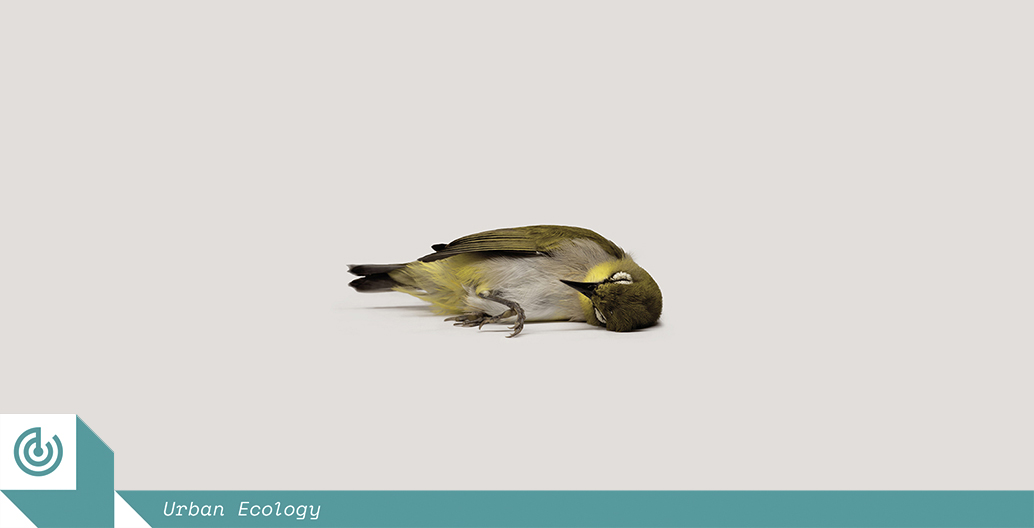
Seen from 28,000 miles away, the earth is beautiful. But its beauty is deceptive. We don’t see the five billion tonnes of surplus carbon we pump into the atmosphere every year, our toxic waterways, our sprawling megacities, or the vast fossil fuelled monocultures of cattle and corn that feed them.
Most importantly, we don’t see the global archipelago of protected areas into which the world’s genetic biodiversity is now huddled. On this Earth Day, 2017 we are launching a new atlas dedicated to examining this archipelago in detail. It’s called the Atlas for the End of the World.
The first atlas, the Theatrum Orbis Terrarum (The Theater of the World) was published in 1570 by the famous book collector and engraver from Antwerp, Abraham Ortelius. With his maps Ortelius laid bare a world of healthy – we can now say “Holocene” – ecoregions ripe for colonization and exploitation. Lauded for its accuracy, the Theatrum quickly became a best seller.
Despite its apocalyptic title, our new Atlas is not about the end of the world per se; it is about the end of Ortelius’ world, the end of the world as a God-given and unlimited resource for human exploitation and its concomitant myths of progress. On this, even the Catholic Church is now clear: “we have no such right” says Pope Francis.

The original Atlas' map of the then "new world".
Abraham Ortelius
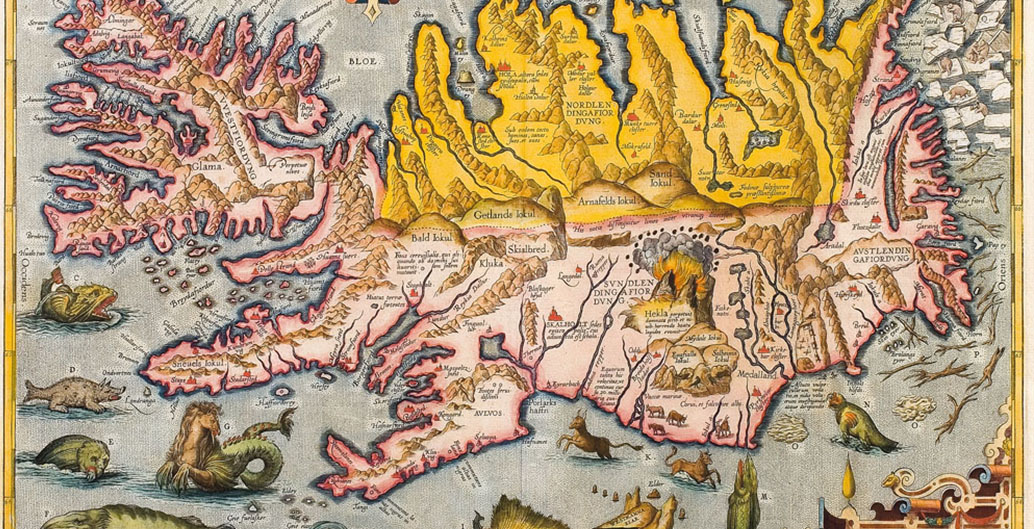
The Atlas' view of Iceland.
At face value, atlases are just books of maps. The maps in the Atlas for the End of the World are however, quite specific. They specifically show the difference between the United Nations Convention on Biological Diversity targets for achieving 17 percent (global terrestrial) protected area by 2020 and what is actually today protected in the 398 ecoregions which comprise the world’s 36 biodiversity hotspots.
The so-called hotspots are regions agreed upon by the scientific and conservation communities as the most important and the most threatened biological places on earth. They are also places of exceptional linguistic diversity, much of which is also predicted to disappear by century’s end, suggesting perhaps, that the fate of nature and the fate of culture is one and the same. Many of the hotspots are also bedeviled by poverty, violence and corruption.
The view from above
When my research assistants and I began this mapping project in 2013, the world’s terrestrial protected area total was hovering at 13.5 percent. Recent figures (2015 data) suggest a total of 15.4 percent. That’s 20.6 million square kilometers of land distributed across more than 209,000 sites in 235 different countries. So, with 15.4 percent already secured, only an additional 1.6 percent protected area is needed to satisfy the convention’s 2020 target. This amount might seem paltry, but 1.6 percent of the earth’s terrestrial surface is 2.3 million km2, the equivalent of nearly 700,000 Central Parks. That’s a Central Park stretching 70 times around the world. The research question we asked was where exactly should this additional protected land be?
According to the convention, we can’t just fence off 1.6 percent of Siberia, or some other place, and then say we’re done. The crucial words in the small print of the convention are that the global protected estate must be “representative” and “connected”. In theory, this means 17 percent of each of the world’s 867 ecoregions should be protected and connected.
The Atlantic Forests hotspot serves as an example. Currently it has only eight percent of its territory under protection. Furthermore, when we break the hotspot down into its 15 constituent ecoregions, we find that nine fall short of reaching 17 percent representation.
In total, 21 of 35 hotspots currently fall short of reaching the 17 percent protected area target. More specifically, 201 of their 391 ecoregions fall short. With the new Atlas, any nation can know how much land needs to be protected and where if it wants to meet its obligations under the convention. This is not to say that blanket targets are always appropriate on the ground, but, it’s a start.
In addition to identifying these protected area shortfalls, the critical nexus this research addresses is the global tension between food production, urbanisation and biodiversity. On the world map (below) are three squares. The first and smallest is the world’s current crop land. The second, in the middle, is current crop land plus current grazing land, plus what is thought to be the world’s further potential supply of arable land (a total of 50 percent of the earth’s ice-free surface area).
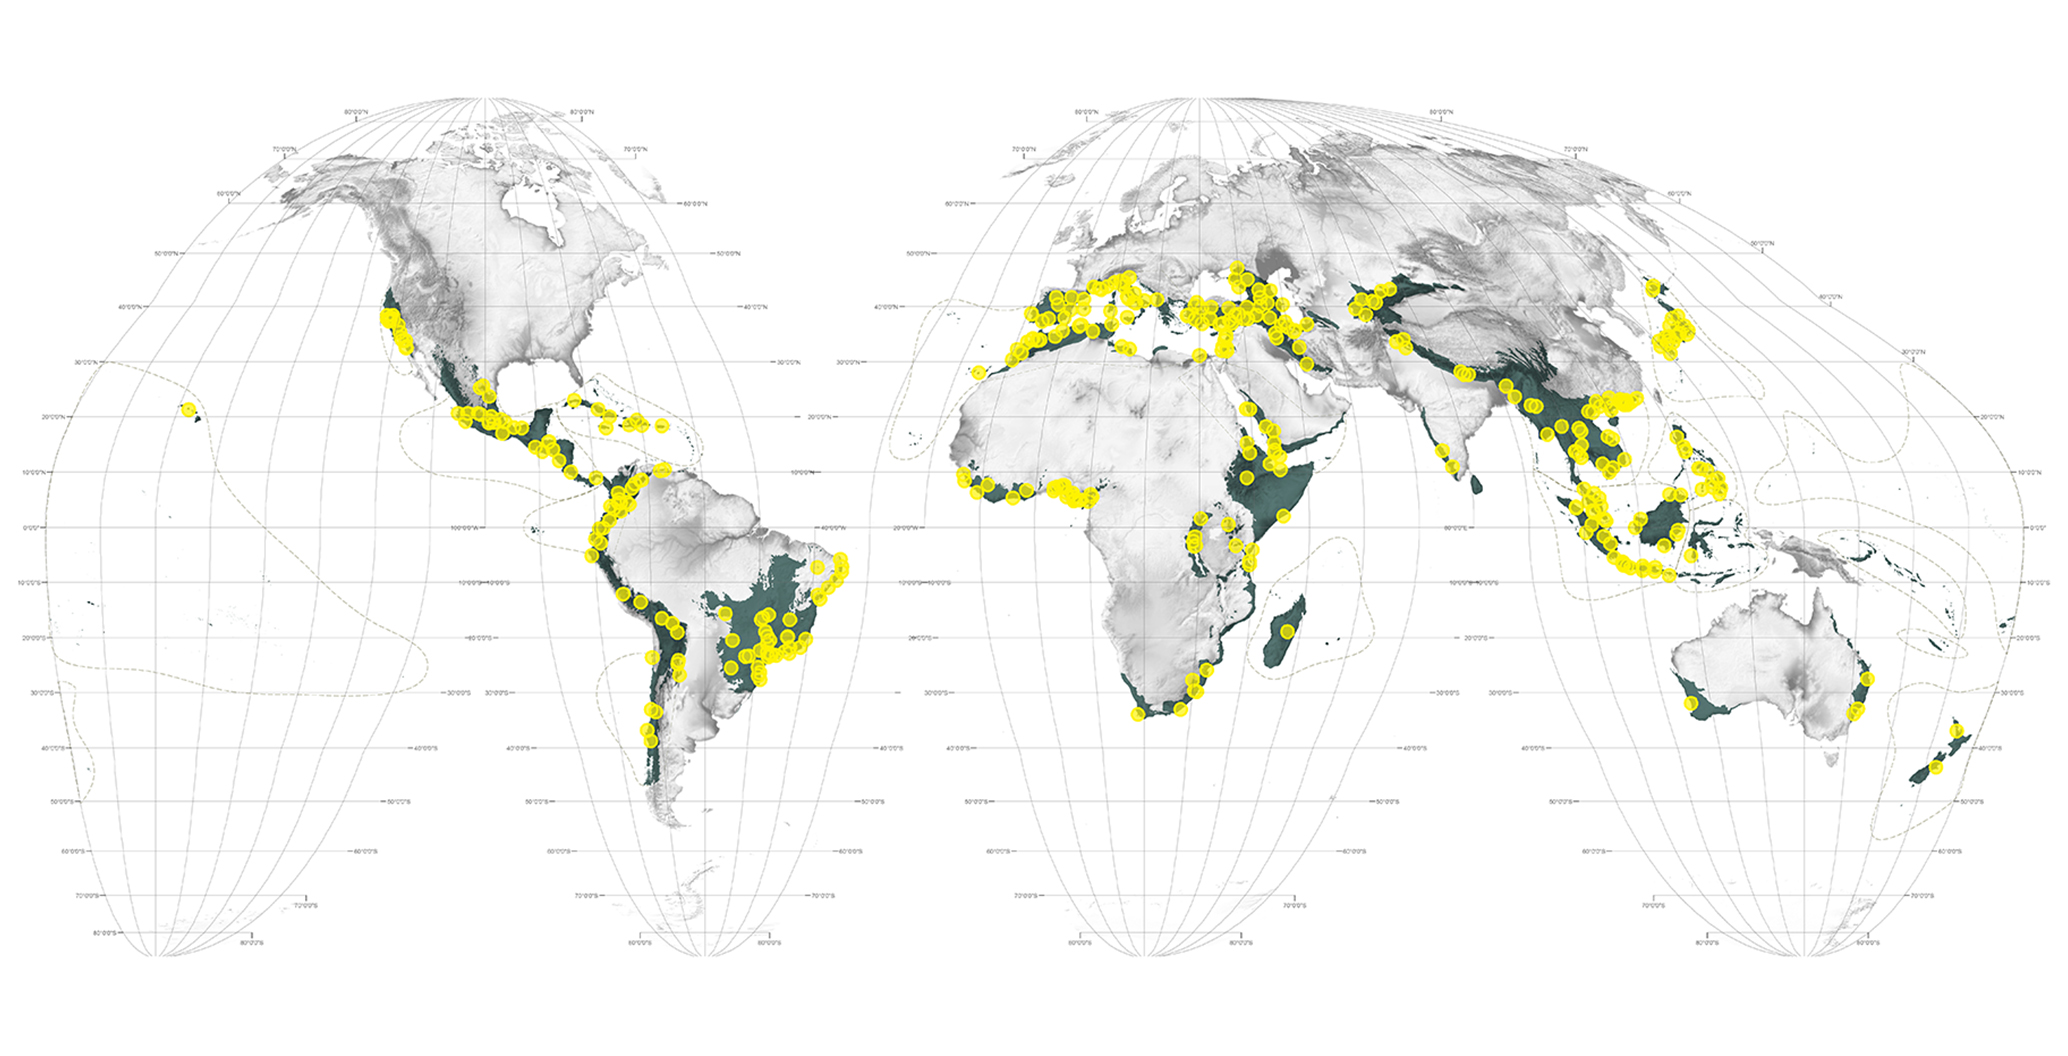
A global roundup of cities within biodiversity's "hotspots".
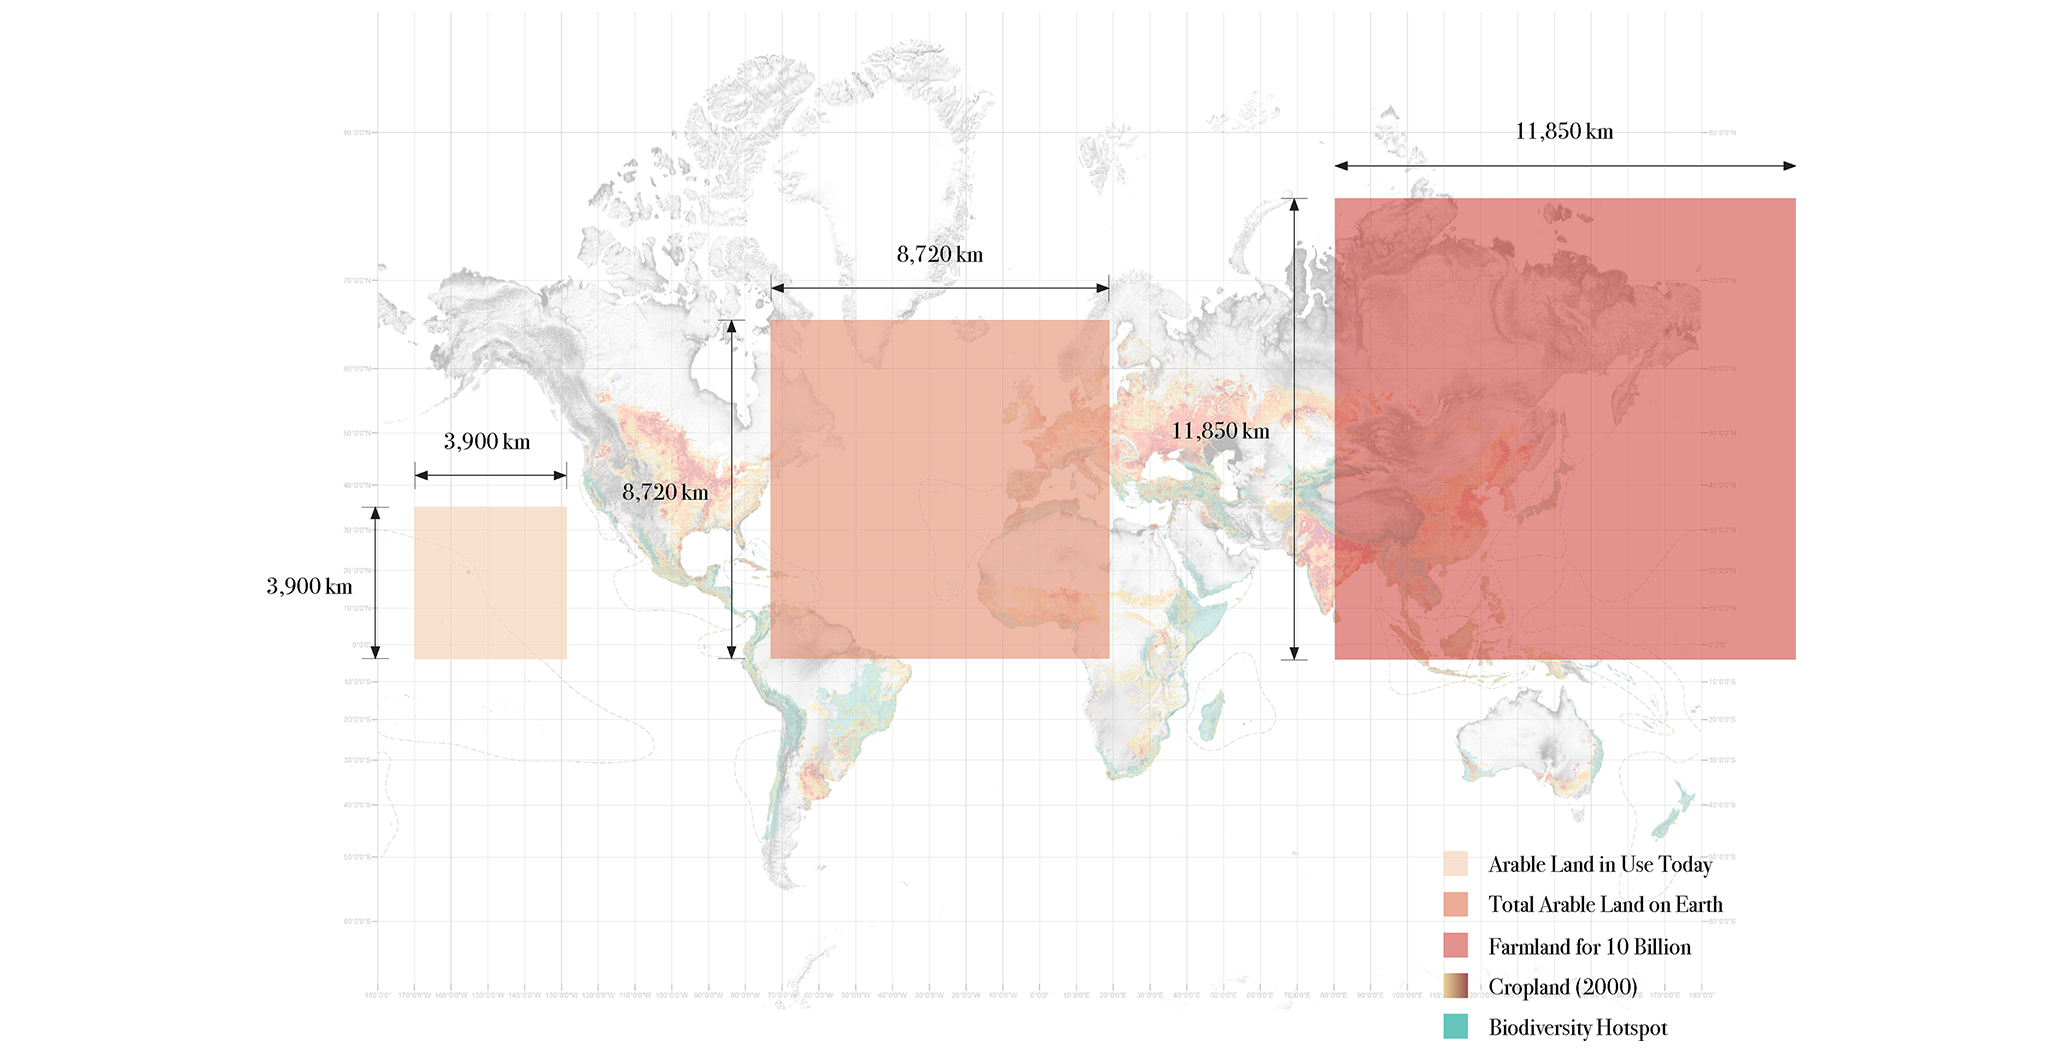
A portrait of the current land for crops, and its future estimated need.
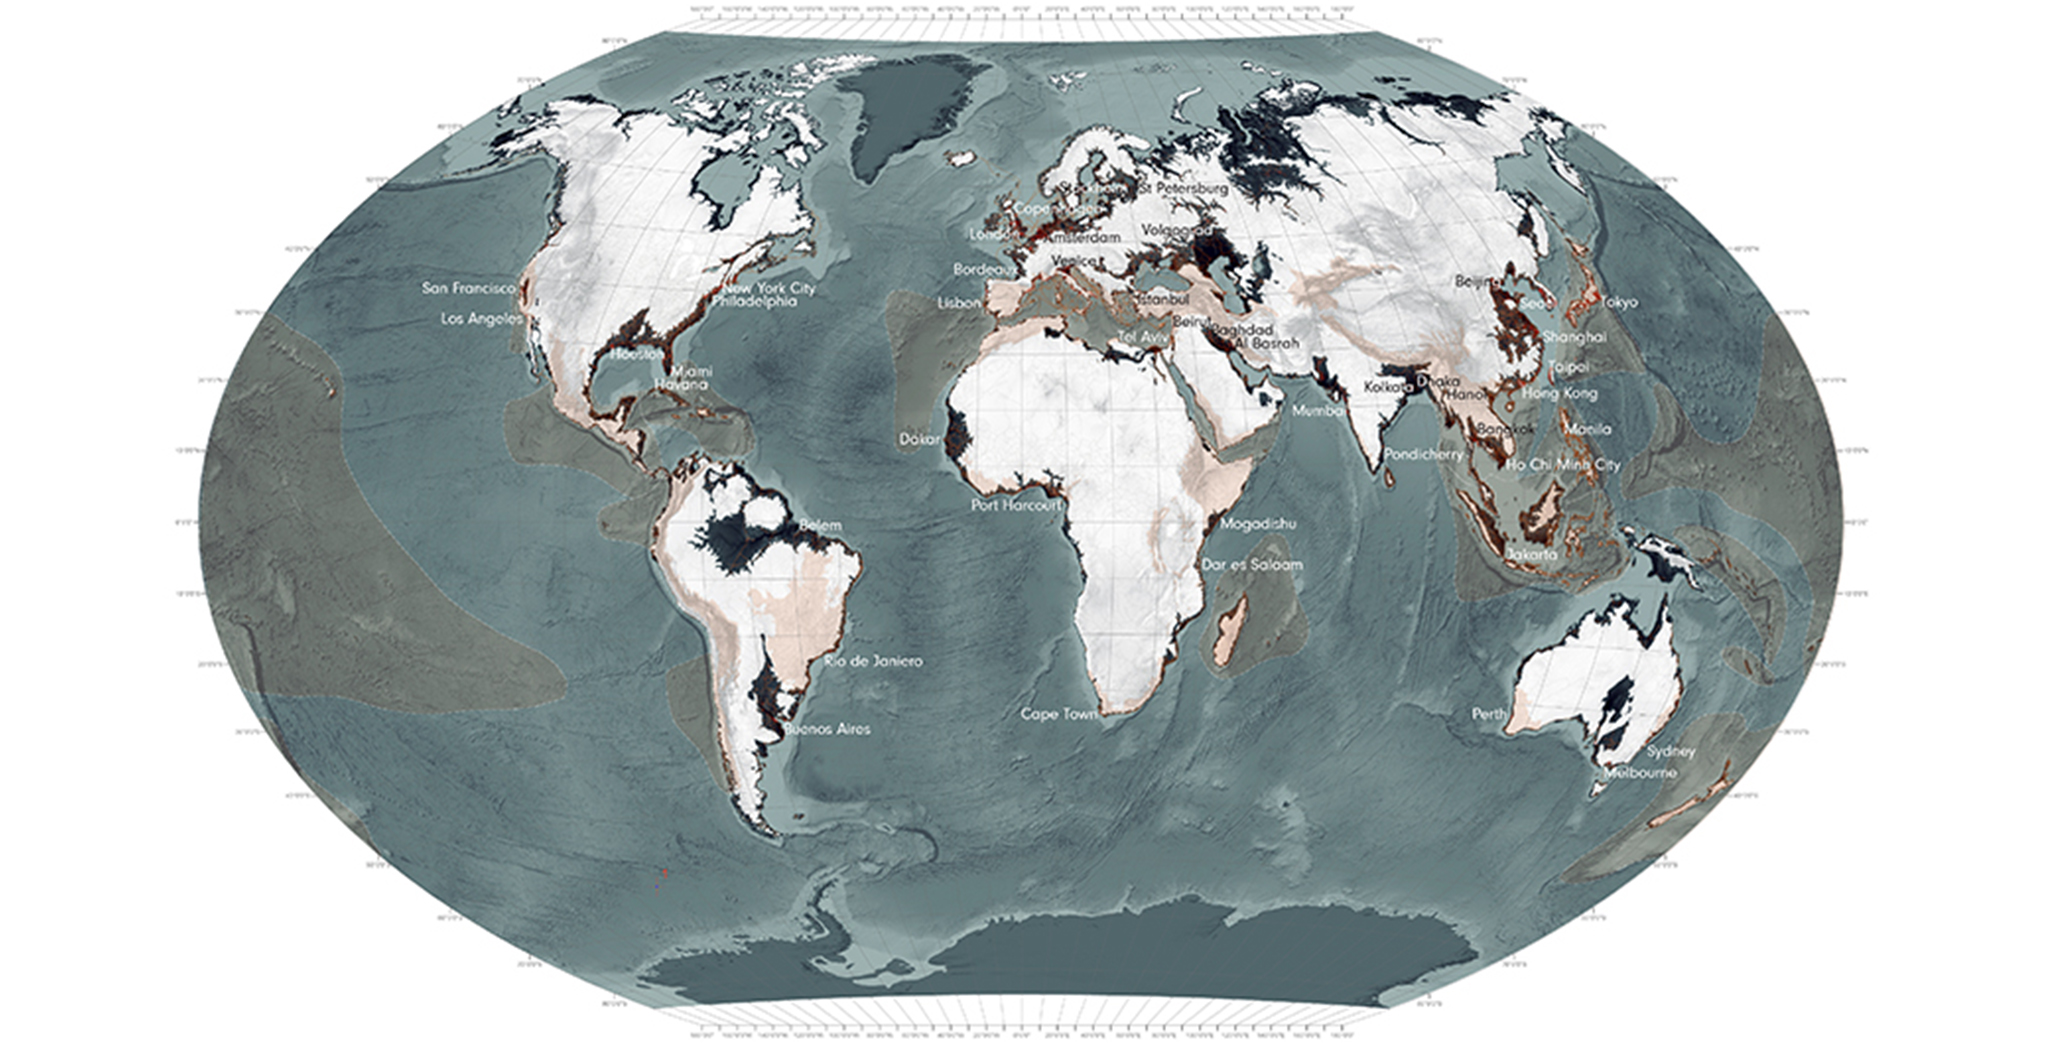
The threat of sea level rises if all ice-caps melted.
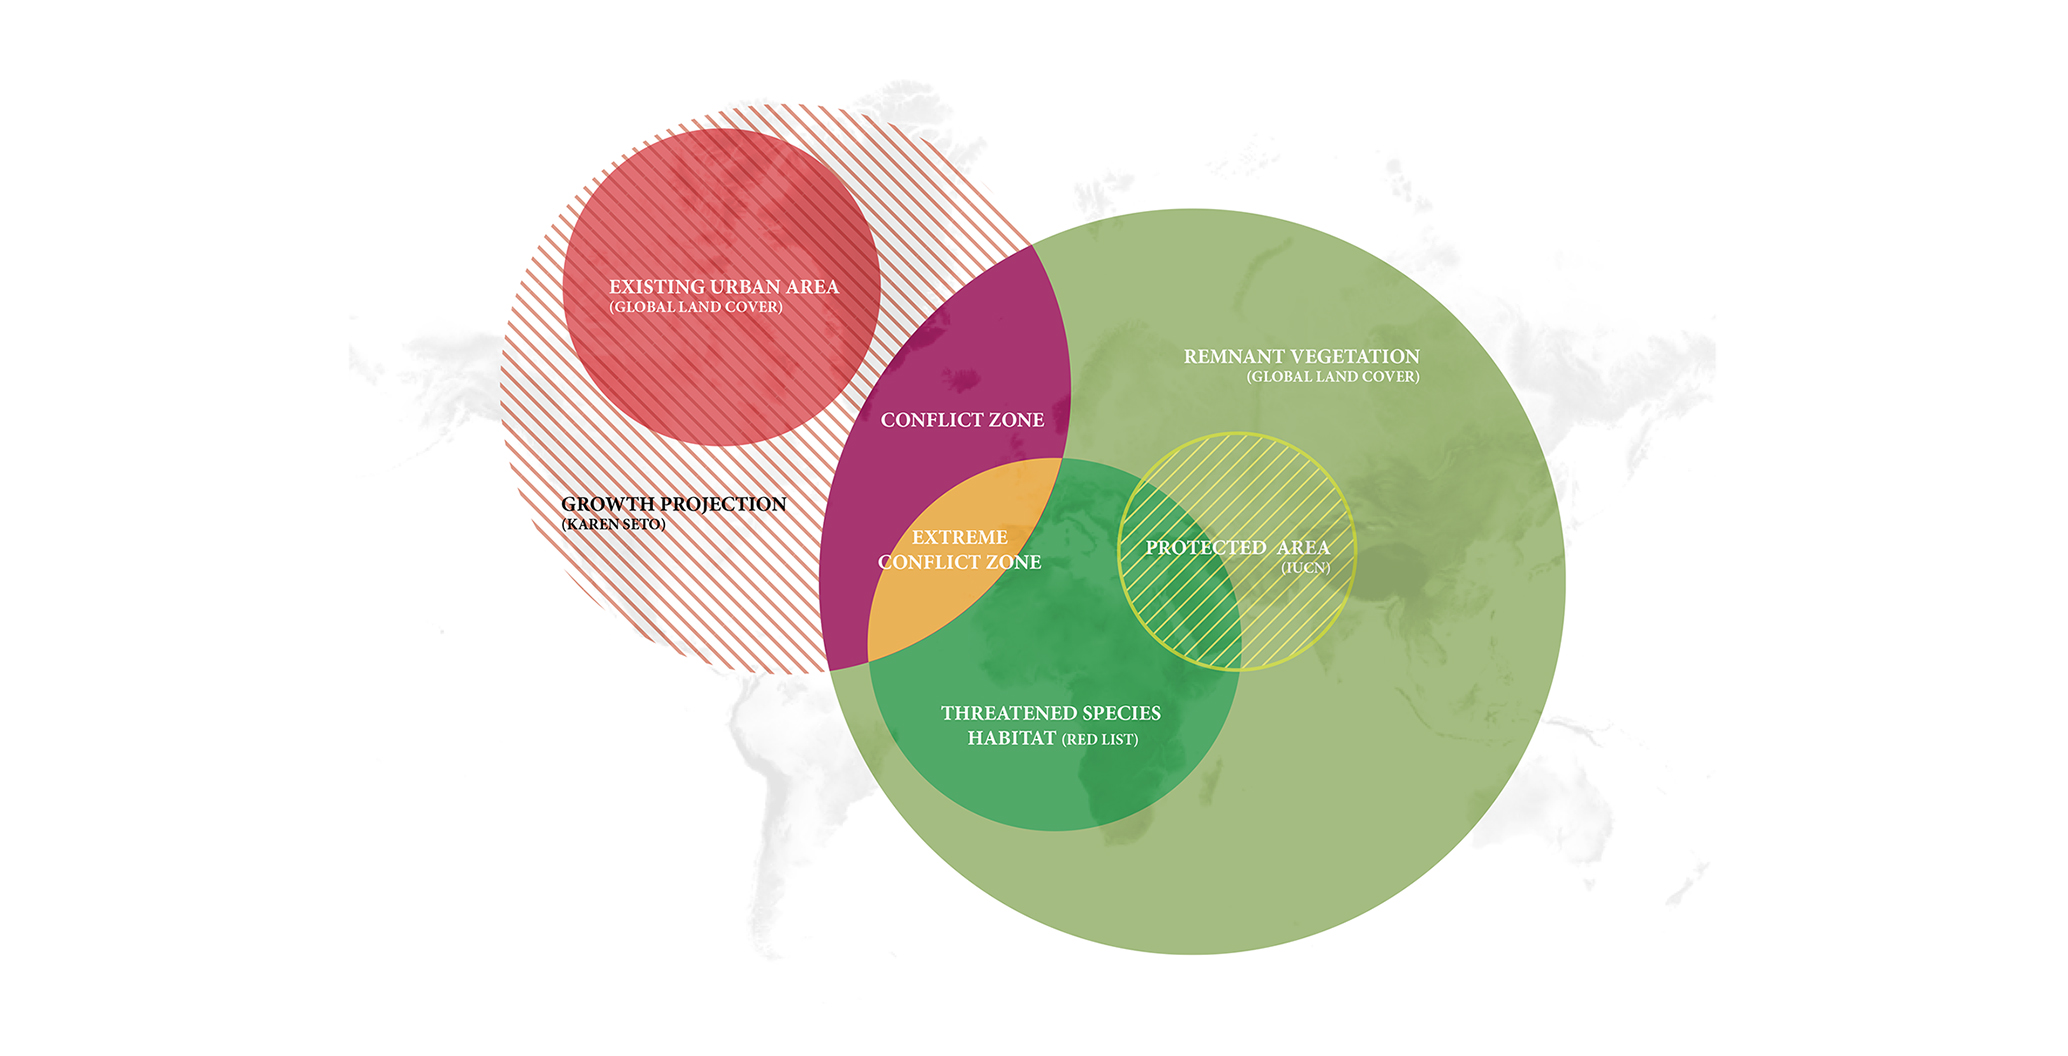
How the authors have defined their biodiversity conflict methodology.
These leave 50 percent of the planet’s land for other uses, exactly what EO Wilson has called for in his book, Half Earth. 50 percent seems like a lot, but remember that 33 percent of this land is desert – land which by definition is not suited to either biodiversity or agriculture. Subtracting the world’s deserts leaves 17 percent for biodiversity – precisely the amount demanded by the convention.
The bigger cause for concern is however the large square on the right: the land area necessary to feed 10 billion people. The UN is now forecasting anywhere between 9.5 and 13.3 billion by 2100, so 10 is a conservative estimate. But these projected 10 billion consumers are not “average” global citizens; let us suppose they are people like us; who shop in supermarkets and eat more or less whatever they want, whenever they want.
They are average US citizens; people with a food footprint of 1.4 hectares each. Ten billion people consuming at this level would require a whopping 93 percent of the earth’s ice-free terrestrial surface. In this scenario, not only would all the world’s arable land be used for agriculture, but so too would the world’s deserts, plus some. After we’ve finished our burgers, a mere seven percent of the earth’s terrestrial surface would be left for biodiversity – for all practical purposes a mountainous zoo in the midst of a global monoculture of corn and cattle, hooked up to desalination plants. These proportions of land-use will likely change when global population drops, as it probably will in the 22nd century due to socioeconomic influences associated with urbanisation.
The other mitigating factor would be if the bulk of food production shifted to the oceans, and/or if meat could be produced independently of ruminants entirely. Then, ecological restoration could take place on a scale commensurate with that which is needed to partially correct the earth system’s current imbalances. The challenge will be to get through this century’s incredibly tight ecological bottlenecks and come out the other end with some ecosystems, preferably the hotspots, partially intact.
If an extra 3 billion people move into cities by 2100, it means we need to build 357 New York cities
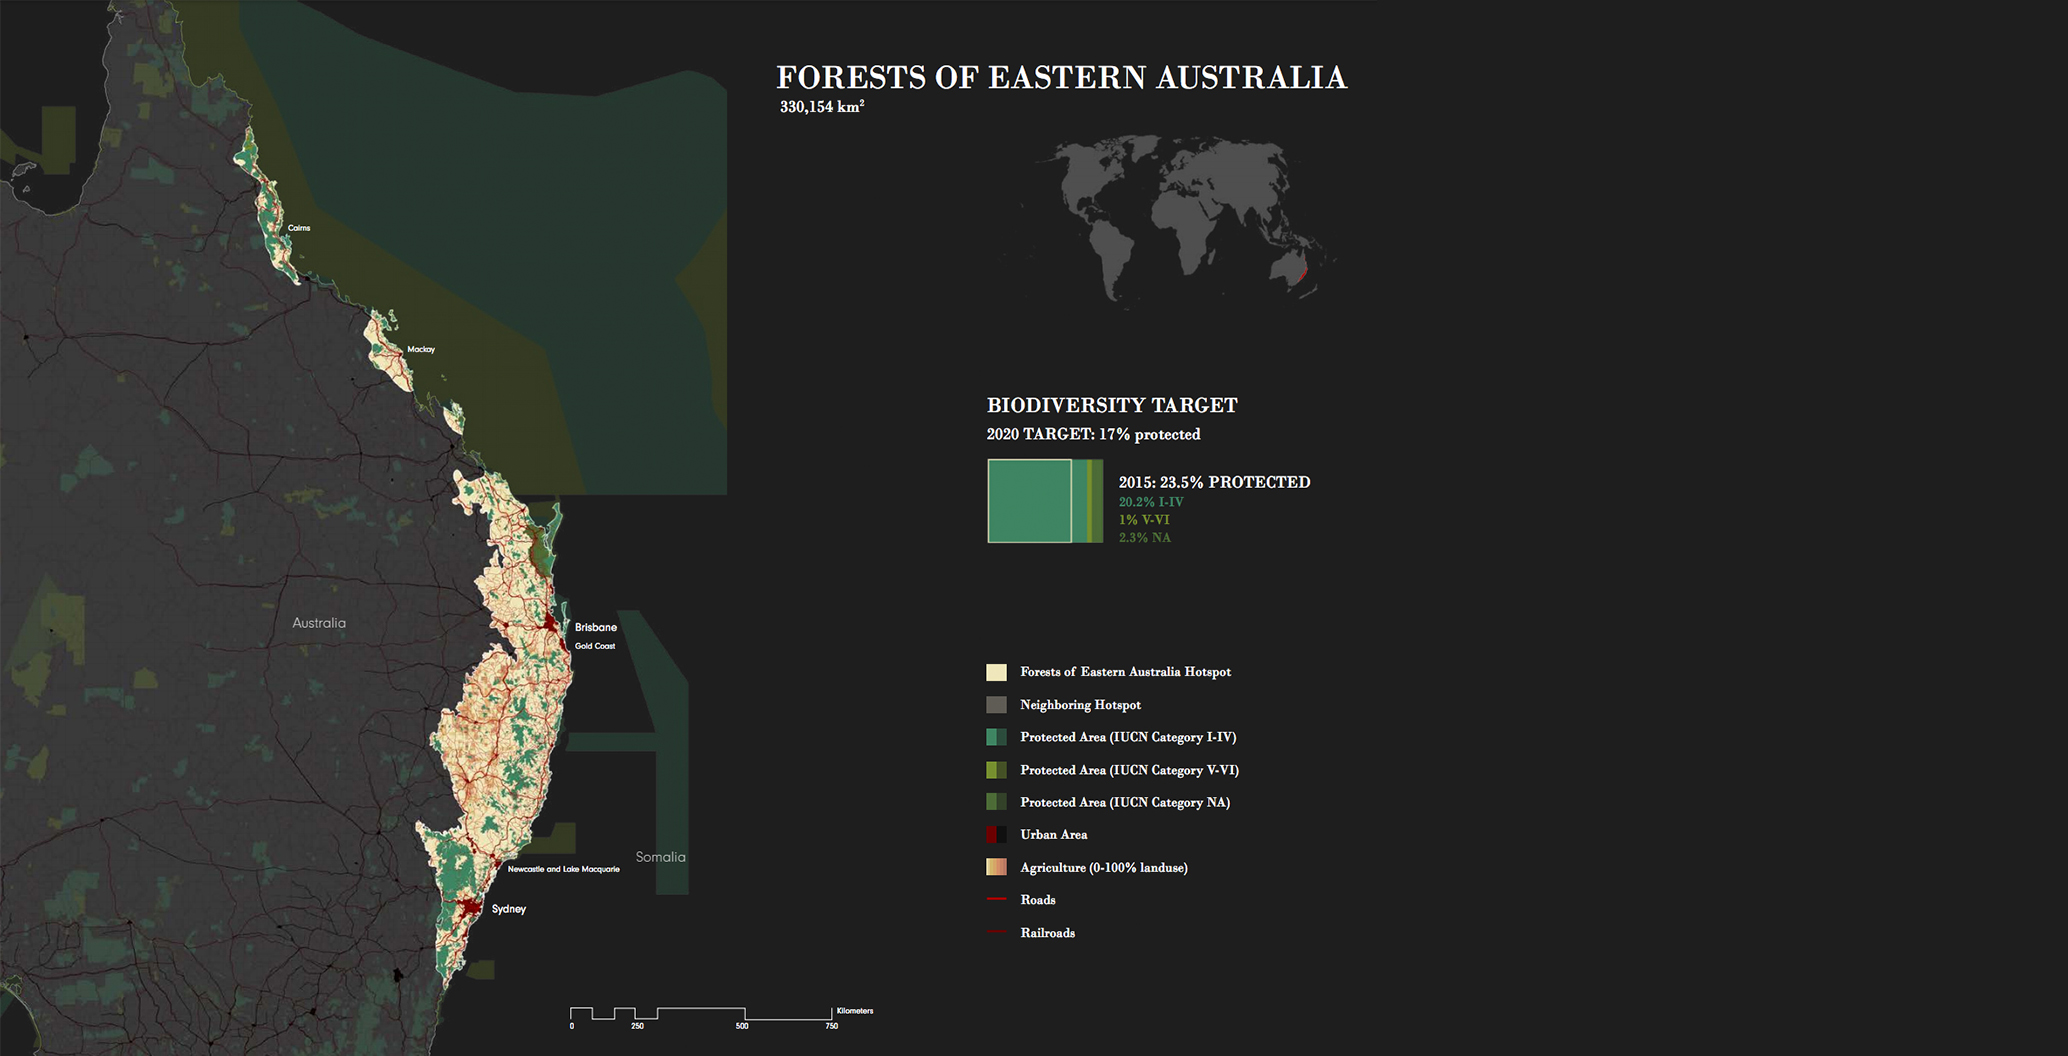
The forests of eastern Australia at a glance.
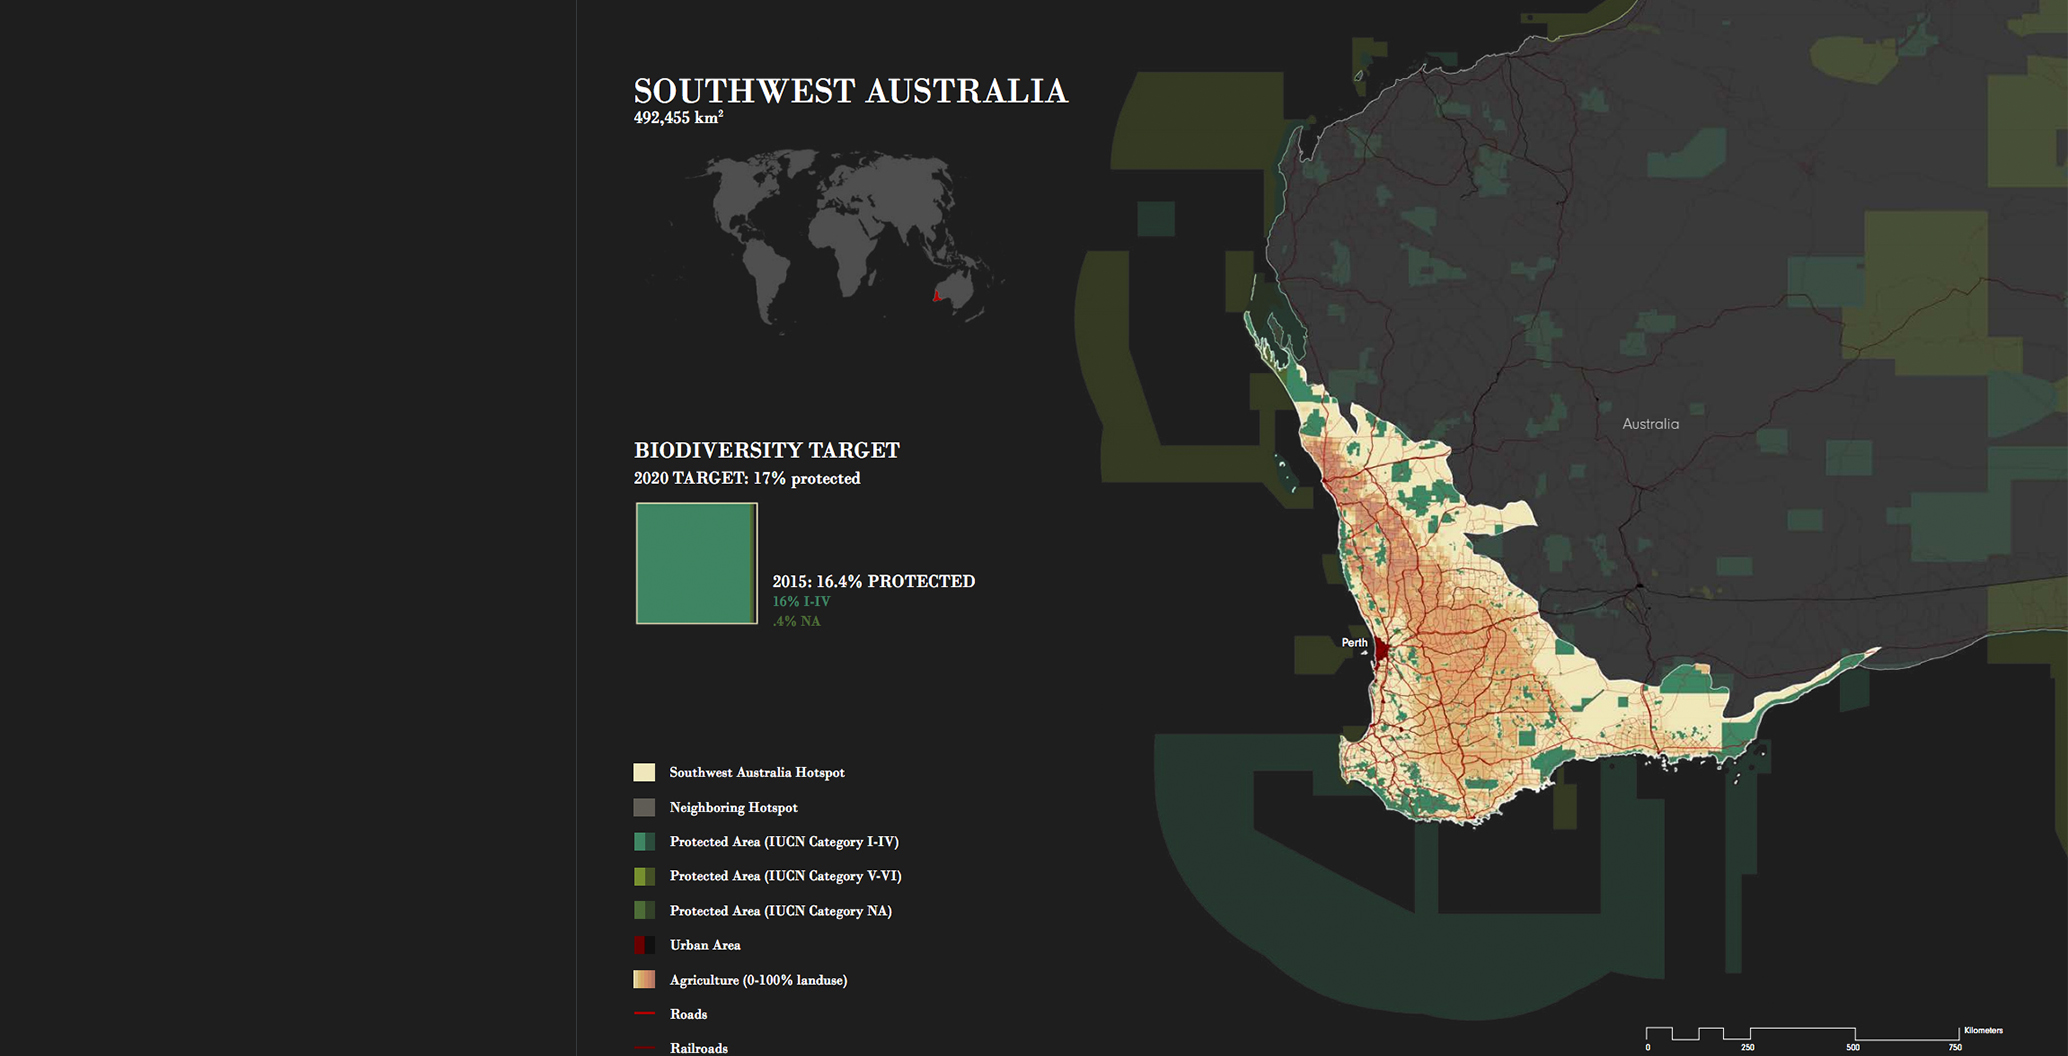
South-west Australia's biodiversity overview.
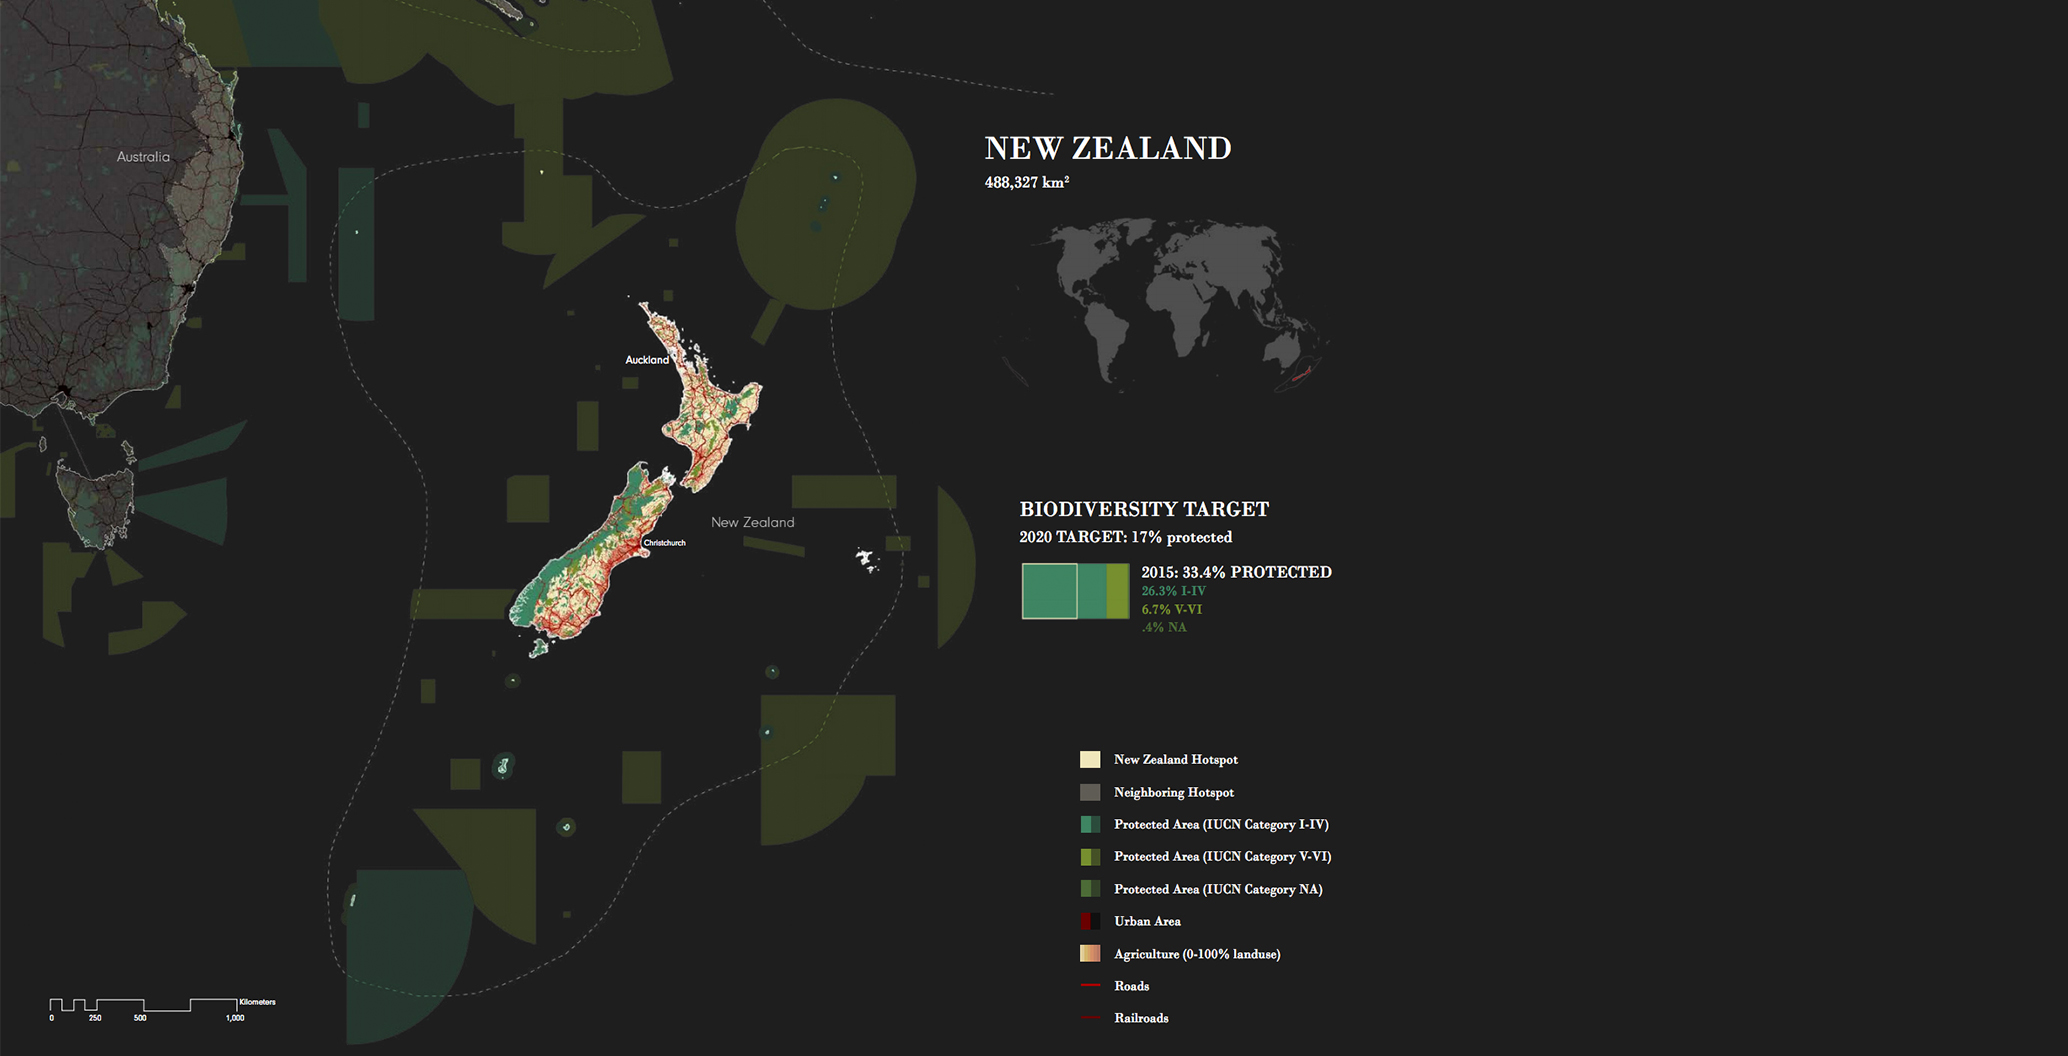
New Zealand's biodiversity at a glance.
The flashpoints between future urban growth and biodiversity
The second major area of this research concerns 422 cities in the world’s hotspots. We zoomed into each city of 300,000 people or more and superimposed their 2030 growth trajectory. We then plotted remnant habitat and threatened (mammal) species from the International Union for the Conservation of Nature’s Red List. What emerges are the flashpoints between future urban growth and biodiversity.
In the circular images of the cities in the Atlantic Forests hotspot, orange indicates zones of imminent conflict between urban growth and biodiversity. Alarmingly, 383 of the 422 cities in the world’s hotspots are on a collision course with unique and irreplaceable biodiversity. And we are not just talking about a little bit of sprawl. If an extra 3 billion people move into cities by 2100, as is entirely likely, it means we need to build 357 New York cities in the next 84 years, i.e., 4.25 New Yorks per year. Much of that growth will occur as both formal and informal sprawl in Africa, India and South and Central America, much of it up against biodiversity and much of it unregulated.
As documented in the Atlas our analysis suggests that most of these 383 cities that are encroaching on valuable habitat don’t have any semblance of as whole-of-city urban planning. This lack of planning at the city scale is also evident at the national scale: almost all the nations in whose jurisdiction the world’s hotspots lie don’t – in so far as we can tell – have national land-use plans incorporating biodiversity.
Under the Convention on Biological Diversity, each nation must develop a national biodiversity strategy and action plan. In practice, these tend to be platitudinous reports and most don’t take into account the 17 percent target for protected area. Most of the nations who are signatories to the Convention on Biological Diversity are also signatories to the Paris Agreement on climate change, which demands that they prepare national climate change plans.
The Atlas for the End of the World lays the ground work for the 142 nations who preside over the world’s biodiversity hotspots to now view climate change, biodiversity and urbanization as interrelated phenomena and plan for the future. To do so would be a new beginning.
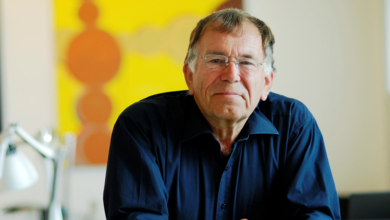
Richard Weller is Martin and Margy Meyerson Chair of Urbanism and Professor and Chair of Landscape Architecture at the University of Pennsylania School of Design. Claire Hoch and Chieh Huang collaborated with Weller on the Atlas as research assistants.